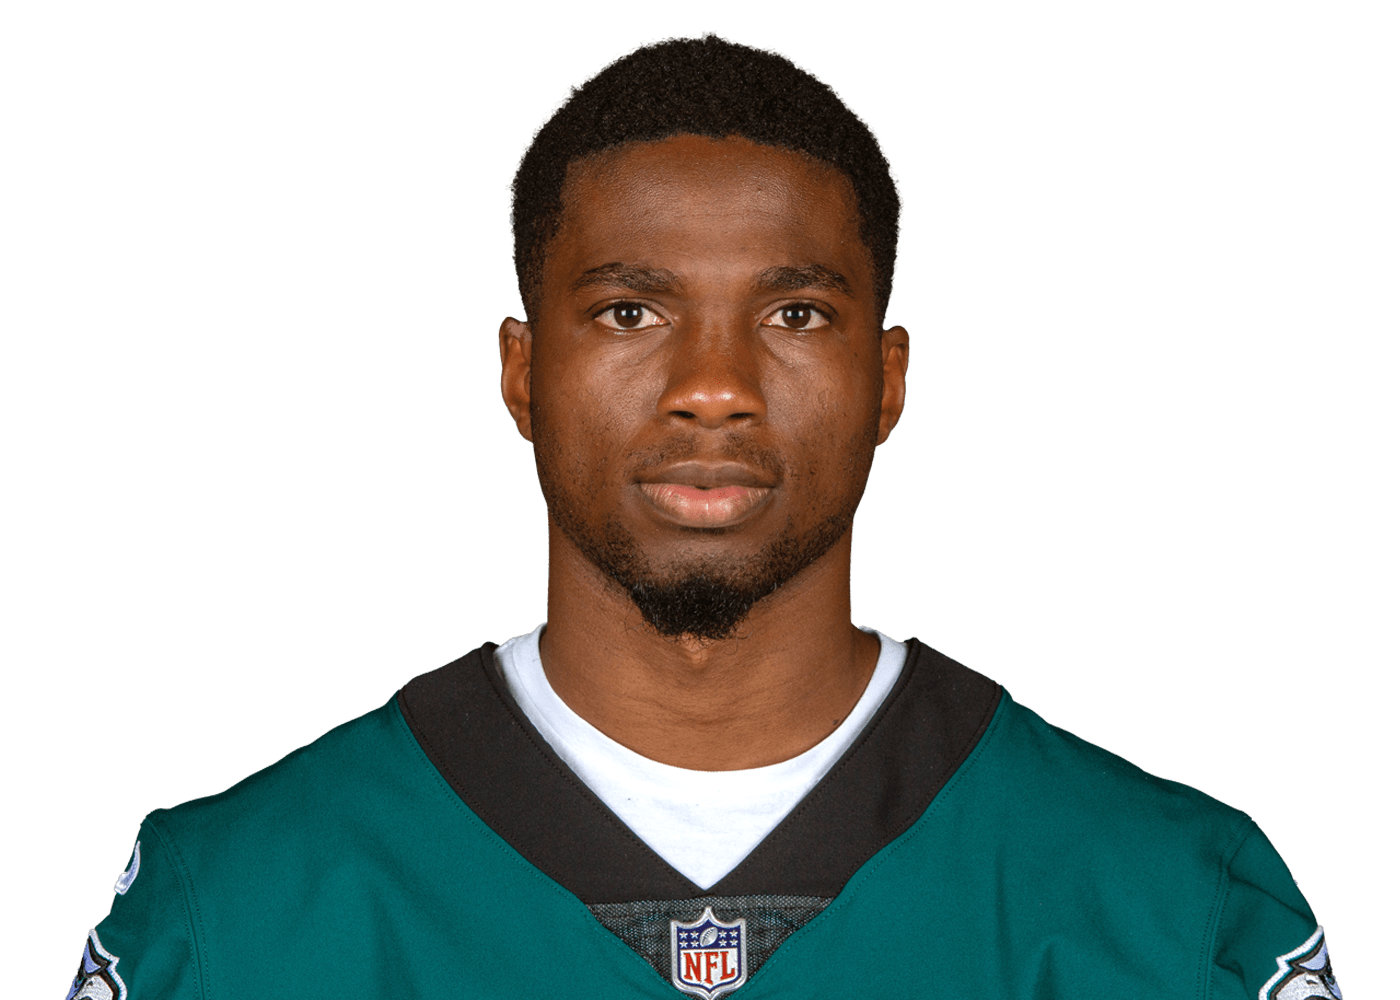
How Deontay Burnett performed against the coverage shell, personnel, box count, and pass rush the defense actually showed — not the offense's own play call. Sourced from nflverse's participation data, which charts a subset of snaps, so samples here run thinner than the Splits tab.
By Coverage Shell — 2018
| Split | Plays | Yds | TD | EPA/Play | Success |
|---|---|---|---|---|---|
| Cover 3 | 5 | 66 | 0 | +1.03 | 60.0% |
| Cover 1 | 4 | 37 | 0 | +1.18 | 75.0% |
| Cover 6 | 2 | 15 | 0 | +0.19 | 50.0% |
| Cover 2 | 2 | 0 | 0 | -3.27 | 0.0% |
Man vs. Zone — 2018
| Split | Plays | Yds | TD | EPA/Play | Success |
|---|---|---|---|---|---|
| Zone Coverage | 10 | 81 | 0 | -0.15 | 40.0% |
| Man Coverage | 4 | 37 | 0 | +1.18 | 75.0% |
By Defensive Personnel — 2018
| Split | Plays | Yds | TD | EPA/Play | Success |
|---|---|---|---|---|---|
| Nickel | 8 | 72 | 0 | +0.42 | 50.0% |
| Quarter | 4 | 61 | 0 | +1.80 | 75.0% |
| Dime | 2 | 10 | 0 | +0.70 | 50.0% |
By Box Count — 2018
| Split | Plays | Yds | TD | EPA/Play | Success |
|---|---|---|---|---|---|
| 6 in the Box | 8 | 78 | 0 | +0.63 | 62.5% |
| Light Box (≤5) | 6 | 65 | 0 | +1.15 | 50.0% |
By Pass Rush — 2018
| Split | Plays | Yds | TD | EPA/Play | Success |
|---|---|---|---|---|---|
| 4 Rushers | 10 | 90 | 0 | -0.03 | 50.0% |
| 5 Rushers | 3 | 39 | 0 | +1.53 | 66.7% |